You may not like what I’m about to say, but it’s true…
Traffic is worthless if it doesn’t convert.
You can spend all the time and money in the world on bringing visitors to your site, but if they’re not converting, your website is basically a leaky bucket – and it’s leaking money.
Now, lots of people have jumped to this conclusion and subsequently jumped on the A/B testing bandwagon. It’s a great start. A/B testing, otherwise known as split testing, is just the process of running a controlled experiment on your website (you send equal parts of your traffic to 2 or more variations and see which converts best).
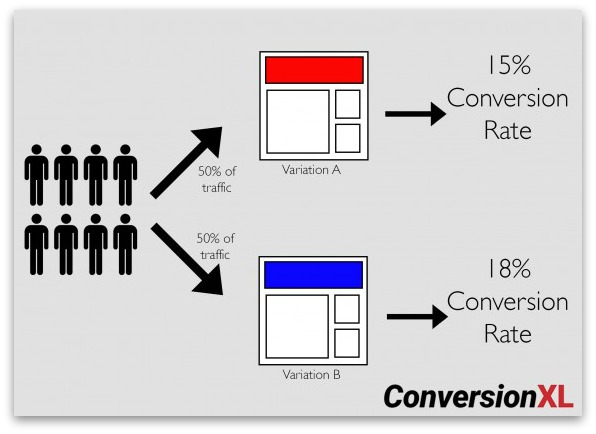
In this post I’m going to show you how to get more out of your A/B tests.
I’m going to show you that if you don’t have a good process for testing, you’re leaving money on the table.
You Don’t Have To Guess What Works
The way it used to be, the highest paid person’s opinion (HiPPO) was the first and last word when it came to making marketing decisions.
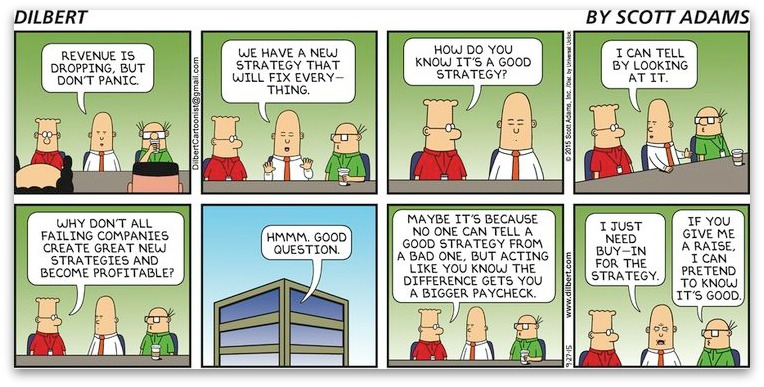
Thankfully, we live in an era where we don’t have to guess, nor do we have to blindly accept unjustified opinions. We can validate decisions with data:
- Digital analytics tools can tell you exactly where your visitors are dropping off.
- User testing and survey tools can give you insight on what the problems might be.
- Anyone can easily implement an A/B test to really see which variation is better.
Even though setting up an A/B test is easy, the process of coming up with great test ideas and prioritizing them is not. Many people are still running down a list of “100 things to A/B test” or picking things at random.
What’s wrong with that? Well, answer me this: would you rather have a doctor operate on you based on an opinion, or careful examination and tests?
Exactly.
So how can you optimize your website if you don’t do proper research, measurement and analysis?
Every action users take on your website can be measured (even though 90% of analytics configurations I come across are broken – important stuff either not measured, or data untrustworthy), giving you insight about your audience (what they want, how they buy and how they’d like to buy).
So how do you go about gathering and using this data for your own business?
How Much Data Do You Need? What Kind of Data?
Let’s say you want to cross the road. Even if you had a ton of information – air humidity, the exact position of the sun, wind speed, number of birds on electric lines, the eye color of the person next to you – it wouldn’t be useful to you. The data you actually need is whether there’s a car coming, and how fast.
It’s the same with website data. You need to start with an objective – like increasing sales, getting more trial starts or more leads. Once you know the goal, start asking questions that might lead to insights about achieving those aims.
So what might those questions look like? They will vary from business to business, but could be something like this:
- Whose problem are you solving?
- What do they need?
- What do they think they want? Why?
- How are they choosing / making a decision? Why?
- What are they thinking when they see our offer?
- How is what we sell clearly different?
- Where is the site leaking money?
- What is the problem?
- What are they doing or not doing on the website?
- What leads more people to do X?
Once you start asking the right questions, you can isolate the data you actually need to make smarter optimization decisions instead of wasting time sifting through useless data simply because it’s available.
But How Do You Gather and Analyze Data?
You need data that you can act on. For every piece of data that you gather, you need to know exactly how you’re going to use it.
And remember: too much data can lead to analysis paralysis. Focus on data that can directly lead to insights. Insight is something you can turn into a test hypothesis.
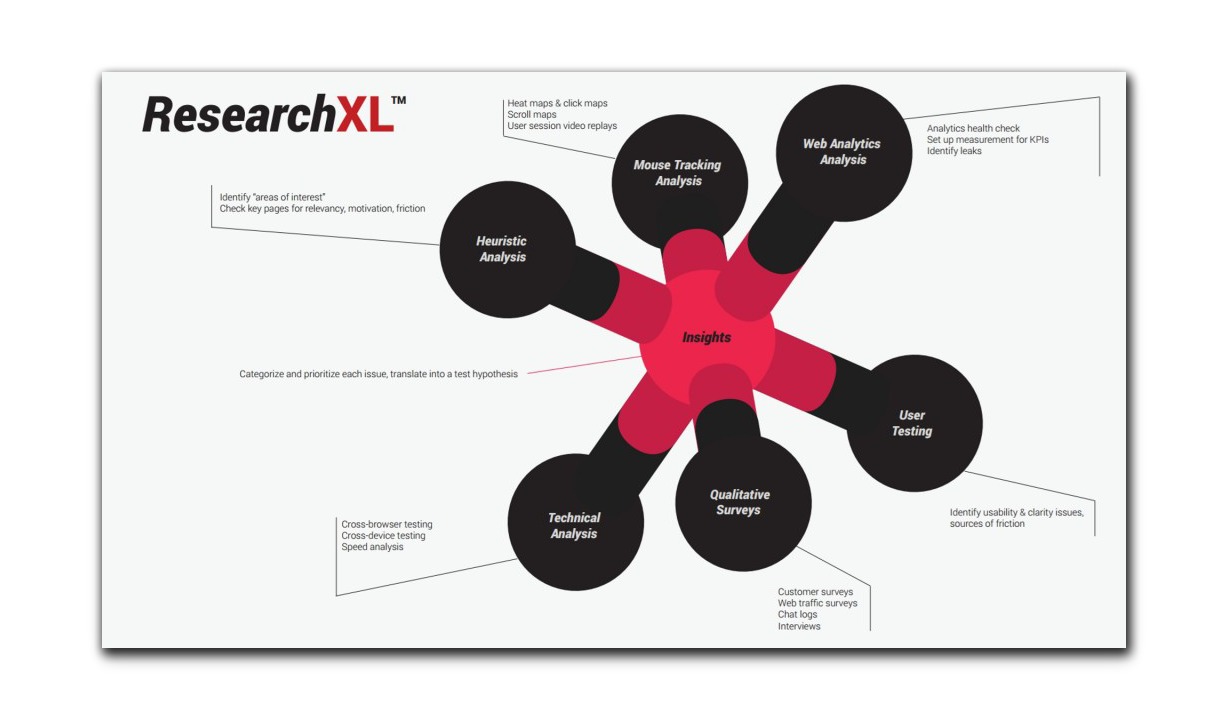
Over years of doing this, I’ve developed a conversion research framework, which I’ve used to improve hundreds of websites around the world. No matter what industry you’re in (e.g. eCommerce, SaaS), you can use it to guide your optimization and make smarter testing decisions.
This framework is called ResearchXL.
6 Steps To Better A/B Test Ideas
ResearchXL is a framework for identifying problems or issues your website has, and turning those into hypotheses you can test. With it, you use six types of data…
- Heuristic Analysis
- Technical Analysis
- Digital Analytics
- Mouse Tracking
- Qualitative Surveys
- User Testing
Once you go through this, you’ll have a clear understanding of what your actual problems are, and how severe each is.
Let’s go through each one.
1. Heuristic Analysis
We define “heuristic analysis” as an expert walkthrough of your website. It’s really as close as an optimizer gets to opinion.
But there’s a difference between an uninformed opinion and that of an optimizer or UX designer who has been working on conversion rates for years. It’s like how an experienced art dealer will be more likely to guess the value of a piece of art than your average Joe… experience does matter to an extent.
Still, we limit this process in two ways:
- Use a framework.
- Think “opportunity areas”
There are many frameworks for heuristic analysis. We judge all web pages based on the following:
- Relevancy: does the page meet user expectation?
- Clarity: is the content / offer on this page as clear as possible?
- Value: is the page communicating value to the user? Can it do so better?
- Friction: what on this page is causing doubts, hesitations and uncertainties?
- Distraction: what’s on the page that is not helping the user take action?
Whatever you write down in this step is merely an “area of interest”. It’s not the absolute truth.
When you start digging into the analytics data and putting together user testing plans and whatnot, make sure you investigate that stuff with the intention to validate or invalidate whatever you found heuristically.
2. Technical Analysis
If you think your site works perfectly well on every browser version and every device, you’re probably wrong. Sorry!
So many sites ignore less popular browser versions and are losing a lot of money because of it. You might have the most persuasive site in the world, but if it doesn’t display properly on the browser/device I’m using, it won’t matter. I’m leaving.
Open up your Google Analytics and go to Audience -> Technology -> Browser & OS Report.
You will see conversion rate (for the goal of your choice) per browser.
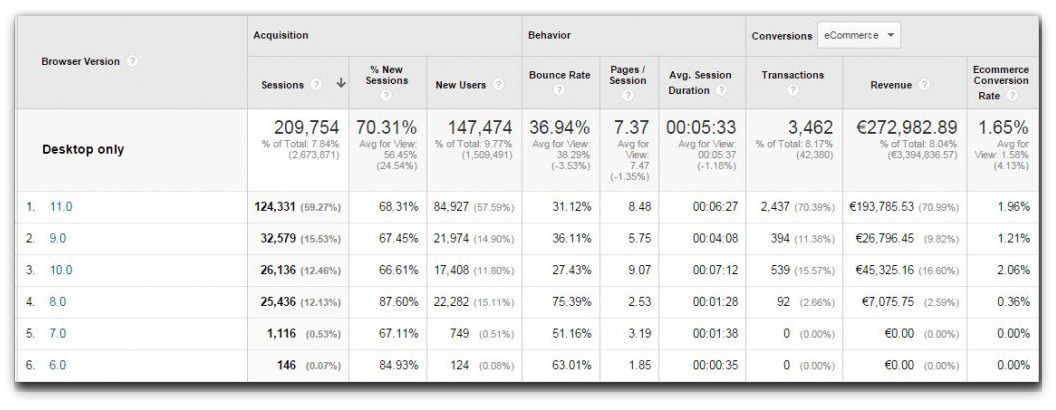
See how IE8 and IE9 conversion rates are near-zero, while IE10 and IE11 convert at around 9%? This is an indication that something is wrong, some possible cross-browser issues there. Time to investigate!
Besides browser testing, site speed can be low-hanging fruit for optimization.
There’s a difference between “page load time” and “page interactive time”:
- Page load time means “seconds until every element on the page is done loading”.
- Page interactive time means “seconds until the site is usable”.
Page interactive time is much more important and is the metric you should be looking at. (Even if a page takes a while to load, if it’s interactive sooner, the perceived user experience is improved.)
Of course, the faster the better, but according to Jakob Nielsen, users can handle up to a 10 second load time. For reference, the typical leading eCommerce site takes about 4.9 seconds to load up usable content.
To find site speed data, log into Google Analytics, and from there: Behavior -> Site Speed -> Page Timings. Turn on the ‘comparison’ to easily spot slower pages.
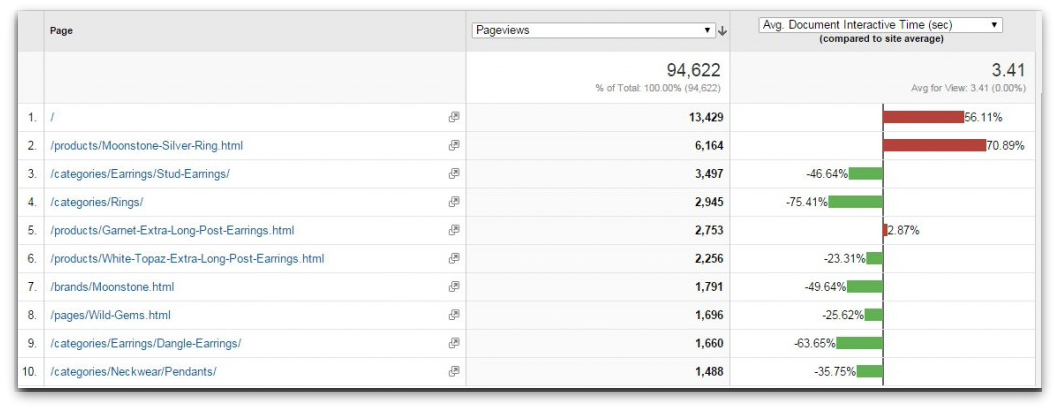
Here we can see that the 2 most-visited pages are also the slowest!
Now use Google Pagespeed Insights (accessible via Google Analytics), to get a diagnostic on your site. Enter all the URLs of slow pages and these tools will find the issues. Fix them!
3. Analyzing Digital Analytics Data
Google Analytics is an optimizer’s best friend. If you’re not good at analytics, then learn up now. It’s crucial to know how to set up reports and analyze web data.
If your analytics skills are limited to seeing how many unique visitors you have, then brush up with this free introductory course from Google.
What can we learn from Google Analytics? Well, a lot. Including:
- What people are doing.
- The impact and performance of every feature, widget, page.
- Where the site is leaking money.
One thing you can’t learn from Google Analytics is the “why”. As in, we can see what, where, when, and who through analytics, but we must use qualitative research and heuristic analysis to find the reasons behind that behavior.
This is important: before you analyze anything, make sure everything is set up right.
Seriously. Nearly all analytics configurations are messed up/broken. If this is the case, your data will be incomplete at best, inaccurate at worst.
So first, start with an analytics health check. This is just a series of analytics and instrumentation checks that tries to answer the question, “Can we trust this data?”
The big point here is that, to collect the right data, everything needs to be set up correctly and you have to have the skills to set up the right reports. Here are some great starter resources on the subject.
Setting things up:
- Google Analytics 101: How To Configure Google Analytics To Get Actionable Data
- Google Analytics 102: How To Set Up Goals, Segments & Events in Google Analytics
- The Beginner’s Guide to Google Tag Manager
Analyzing the data:
- 10 Google Analytics Reports That Tell You Where Your Site is Leaking Money
- 7+ Under-Utilized Google Analytics Reports for Conversion Insights
- 12 Google Analytics Custom Reports to Help You Grow Faster
As I mentioned, analytics can only tell you the “what” and the “where”. To run better tests, we also want to find the “why”.
4. Qualitative Surveys
For qualitative surveys, I like to start out with polling tools.
Research says that most people on your site won’t buy anything. One thing that helps us understand why people aren’t buying is on-page website surveys.
There are two versions of this:
- Exit surveys: hit them with a popup when they’re about to leave your site.
- On-page surveys: ask them to fill out a survey as they’re visiting a specific page.
Seems like everyone is making a tool for triggered surveys nowadays, but here some that I’ve used and enjoyed:
They’re all easy and intuitive to set up, but remember: the tool isn’t as important as your survey strategy. Before you ever send a question to a customer, you should:
- Configure which pages to have the survey on.
- Write your own questions (no pre-written, template bullshit).
- Determine the behavioral criteria for when to show the survey.
That’s it. And don’t worry too much about whether or not the surveys are annoying people – the insights you’ll gain are worth it.
What questions should your surveys ask?
You’re looking for actionable insight here. You’re trying to increase conversions, so you want data that will hint at ways to do that.
Start with trying to identify sources of friction. What are your audience’s fears, doubts, and uncertainties while on a specific page? To find out, an effective question could be, "Is there anything preventing you from signing up at this point?"*
Maybe you want to see if your page is clear and has sufficient information. In which case, I would ask, “Is there any information you’re looking for on this page, but can’t find?”
However you do it, the goal is to uncover bottlenecks and drop-off points for would-be conversions.
Also note that, depending on your specific goals, there are tons of use cases for on-page surveys. Here is a good list of questions from Qualaroo.
Surveying Existing Customers
The second type of qualitative surveys is email surveys for existing customers.
Customer surveys are slightly different than on-page surveys, solely due to the fact that via customer surveys you’re getting answers from current/existing customers. They can offer a trove of qualitative insight.
Problem is, most people are seriously messing up their customer surveys.
Survey design is a complex topic that some people have studied for years, but let’s sum it up in a way that will be actionable to you and your CRO efforts:
- Send an email survey to recent first-time buyers (if they bought too long ago, their memories of the experience aren’t reliable).
- Filter out repeat buyers (they skew results).
- Try to get about 200 responses (after ~200 there are diminishing returns on insight; the answers start repeating).
- Don’t ask yes/no questions.
- Avoid multiple choice (though, these can be very beneficial for other types of customer surveys, where you’re quantifying/coding the data).
The biggest point, though, with anything qualitative, is that you should start with your goal and work backwards. What do you want to learn from your customers? Design questions based on the research goals.
5. Mouse Tracking, Session Replays and Form Analytics
Mouse tracking is one of the less important spokes of the research process, but we can still gain some insights here.
Here are some of the different types of mouse tracking technologies (and related tools):
1. Mouse Movement Heat Maps
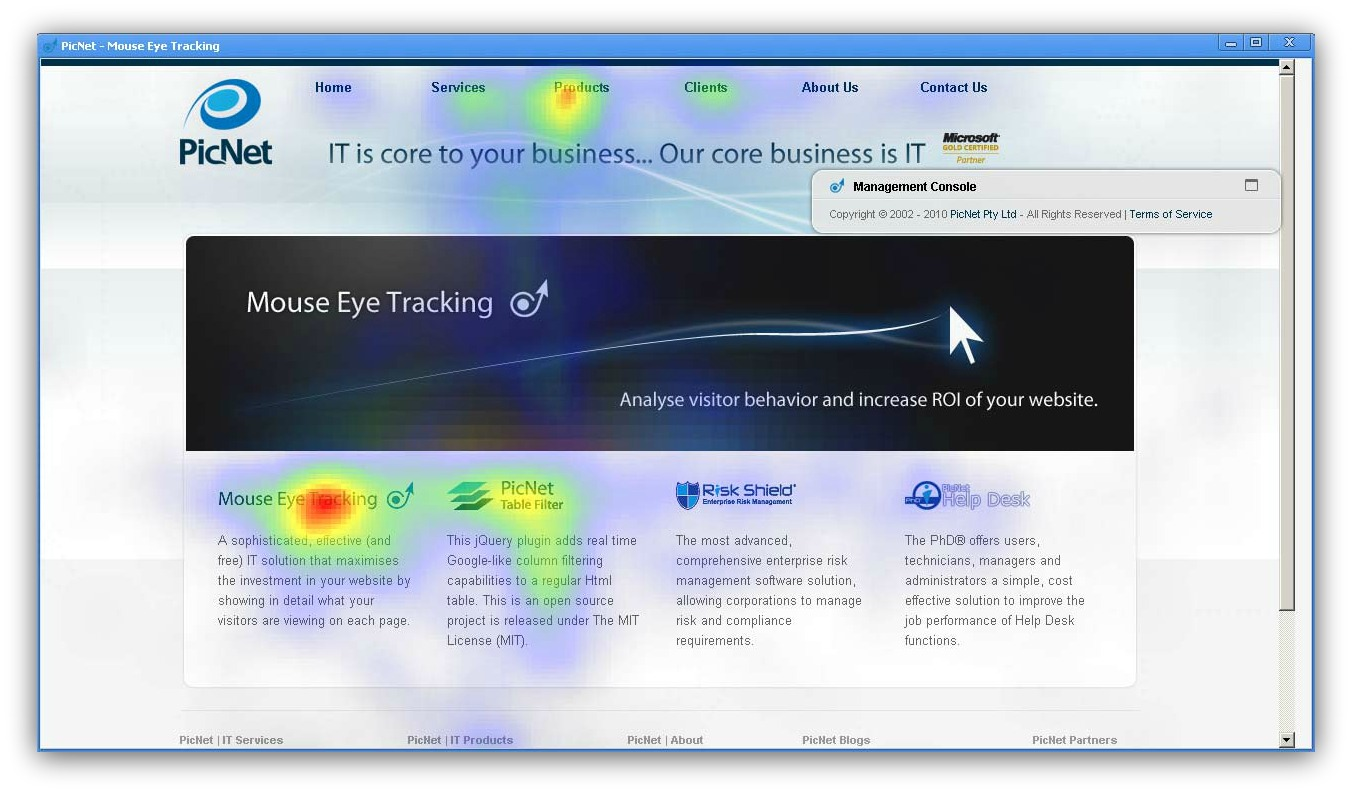
A ‘heat map’ typically refers to a graphical representation of data where the individual values contained in a matrix are represented as colors. Red equals lots of action, blue equals no action, and there are colors in between.
Most of the time, people are talking about hover maps when they talk about heat maps. You can also use algorithmic tools, especially if you have lower traffic, to generate heat maps.
The accuracy of heat maps in general is questionable, so don’t put much stock in the data here.
2. Click Maps
Just as it sounds, click maps track where people click.
The visuals make it easy to explain things to other executives and team members. Another good use for them is to identify if users are clicking on non-links. If you discover something (image, sentence etc.) that people want to click on, but isn’t a link, then either make it a link or change the appearance so it doesn’t look like a link.
3. Scroll Maps
This shows you scroll depth – how far down people scroll. These are very useful for designing sales pages or even just with content – you can identify the exact spots in your design where people drop off – typically because of the use of false bottoms.
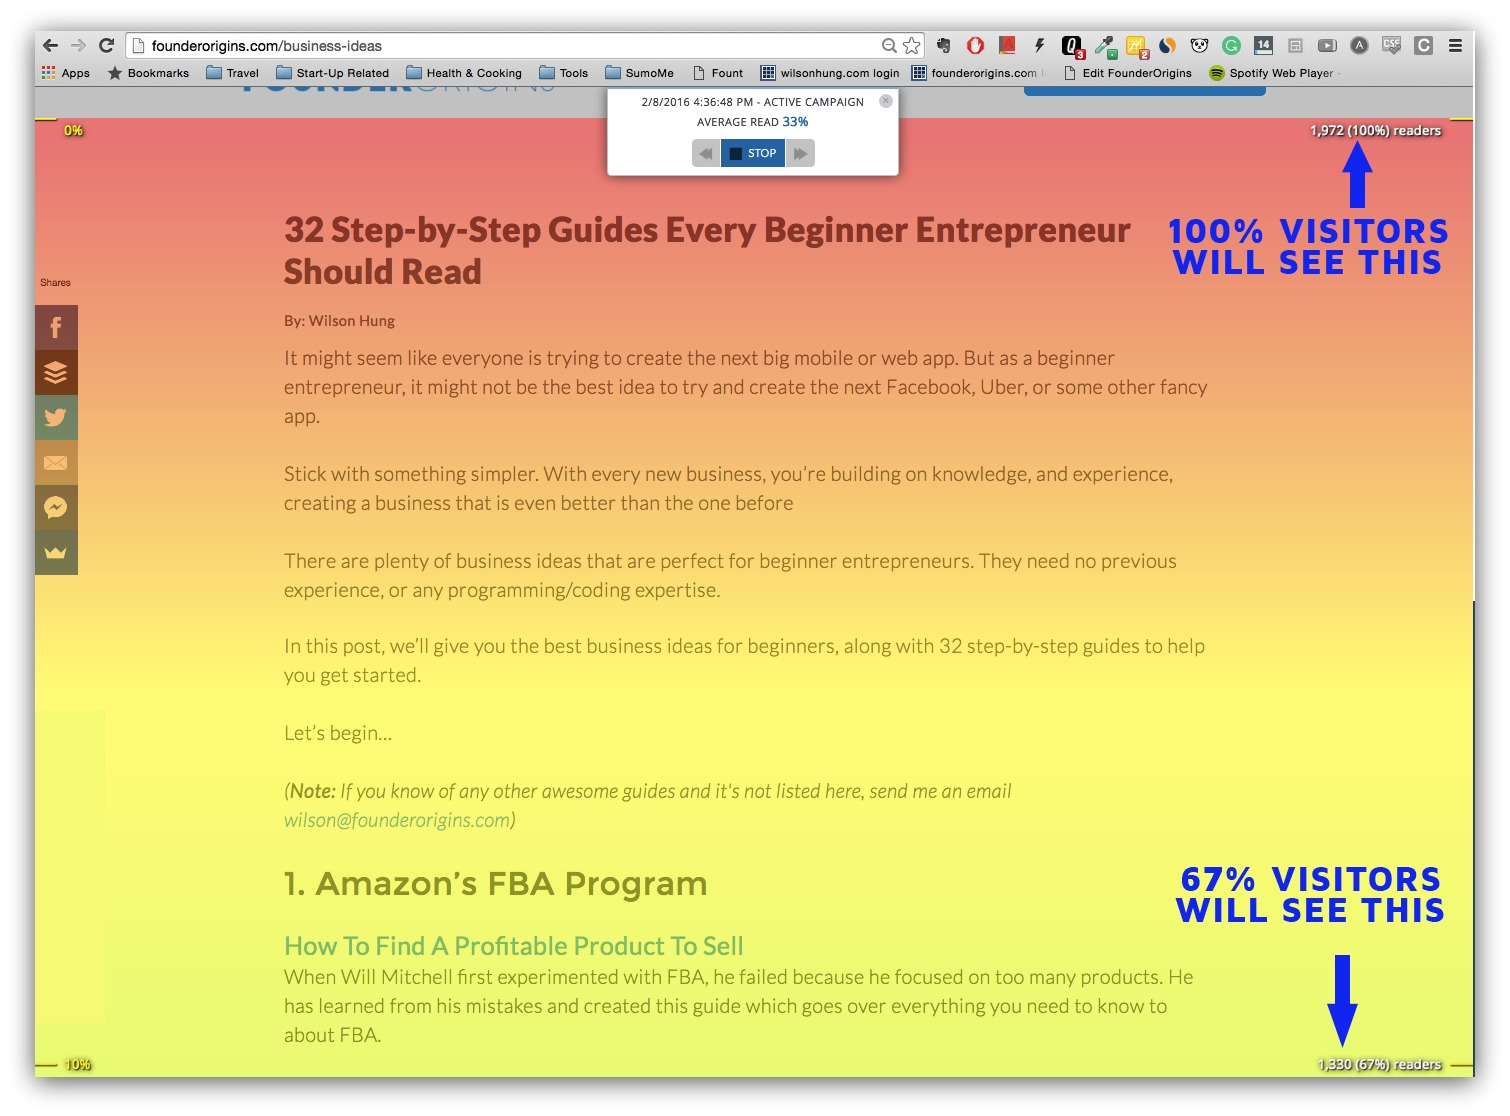
If you find that people are dropping off earlier than you’d like, you can reassess the importance and positioning of your content, or add better eye paths and visual cues to direct them down the page.
4. User Session Replays
Many tools also offer the capability of recording video sessions of your users. You can play back videos of users browsing through your website.
It’s like user testing but no script or audio, and they’re actually using their own money, so you can reach some new insights here.
Let’s say you have a step in your funnel where a lot of people drop out. Why? Just watch videos of people going through that URL, and pay attention to what they do. You will learn a lot.
5. Form Analytics
Not necessarily mouse tracking, but most of the tools in this category (like HotJar, ClickTale, Inspectlet) have this feature – or you can use a standalone tool like Formisimo.
Form optimization is a key part of optimization, and this is where form analytics come in. These tools basically identify where users are dropping off, which fields draw hesitation, which fields draw the most error messages, etc.
6. User Testing
User testing lets you watch people use your site in real-time while they comment on the process.
The quality of the insight you get is entirely dependent on the quality of the tasks you give testers. Here are the 3 types of tasks you should usually include:
- A specific task (find straight-leg, dark washed jeans in size 33×32).
- A broad task (find a pair of jeans you like).
- Funnel completion (buy this pair of jeans).
Tools for this branch of research include things like:
Putting It Together: How To Prioritize Your A/B Tests
These six spokes of our ResearchXL model should have given you sufficient insight and issues to work on.
Now you can to categorize them in a way that promotes efficiency. Dump them into the following 5 buckets:
- Test. This is the bucket for things with a big opportunity to shift behavior and increase conversions.
- Instrument. Include things that need technical tweaking in this bucket – such as beefing up analytics reporting, fixing/adding/improving tag or event handlings, and any other implementation fixes that may be necessary.
- Hypothesize. Include things in this bucket that, while you know there is a problem, you don’t see a clear single solution. Then, brainstorm hypotheses, and driven by data and evidence, create test plans.
- Just Do It. No brainers go here. This is where a fix is easy to implement or so obvious that we just do it. Low effort or micro-opportunities to increase conversions right away.
- Investigate. Things in this bucket require further digging.
Next, prioritize the items in your bucket using a 1-5 star scoring system (there are many ways to prioritize tasks, but this works well for us.) 1= minor issue, 5 = critically important. The two most important things to consider when giving an item a number are:
- Ease of implementation (time/complexity/risk).
- Opportunity score (subjective opinion on how big of a lift you might get).
Use a good old-fashioned spreadsheet to map every issue (click here to download it). Set up a 7-column spreadsheet… it should look something like this:
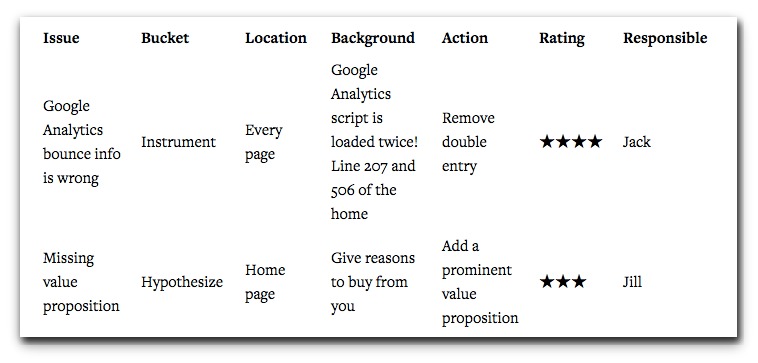
Beginners in optimization are often worried about “what to test”, which breeds listicles offering ‘101 things to test right now’. Funnily enough, after doing conversion research, what to test is never a problem (you usually identify 50-150 issues).
Once you prioritize, you can begin writing and testing hypotheses. A good way to write your hypothesis is like this (credit to Craig Sullivan):
“We believe that doing [A] for people [B] will make outcome [C] happen. We’ll know this when we see data [D] and feedback [E].”
What’s Next?
Now that you’ve got a list of ~100 actual problems your website has, start tackling them by testing treatments or just fixing problems if they’re obvious usability issues.
Conversion Research Trumps Educated Guesses
The quickest way to improve your conversion rate is to start addressing the specific problems your website has. There are 2 ways to figure out what the problems really are:
- Testing.
- Research.
Just “testing out” ideas is completely random and a huge waste of everyone’s time and money.
You need to do better than that, and that’s where the ResearchXL framework comes in. It helps you identify the specific issues your website has, so you will be actually testing stuff that makes a difference.
To get started…
- Conduct heuristic analysis on key pages. Check for relevancy, motivation and friction.
- Ensure your site displays properly on every browser and device. Does it load quickly, too?
- Lean on Google Analytics, but ensure it’s set up correctly with a health check. Does it collect what you need? Can you trust the data being collected?
- Understand the why behind your data with qualitative surveys (exit surveys or on-page surveys). Focus on identifying fears, doubts and uncertainties.
- Use mouse tracking, session replays and form analytics to identify issues. Are people clicking on non-links? At what point do people drop off? Which form fields draw hesitation?
- Watch people perform a specific task, a broad task and funnel completion on your site. You’ll learn a lot.
Add A Comment
VIEW THE COMMENTS